ČSN ISO 2041 - Vibrace, rázy a monitorování stavu – Slovník
| Stáhnout normu: | ČSN ISO 2041 (Zobrazit podrobnosti) |
| Datum vydání/vložení: | 2020-04-01 |
| Zdroj: | https://www.iso.org/obp/ui#iso:std:iso:2041:ed-4:v1:en |
| Třidící znak: | 011400 |
| Obor: | Mechanika |
| ICS: |
|
| Stav: | Platná |
‹
Nahlásit chybu
 Legenda Y imaginární část výchylky X reálná část výchylky Obrázek 5 – Nyquistův diagram POZNÁMKA 1 k heslu Frekvence se implicitně vynáší podél výsledné křivky. POZNÁMKA 2 k heslu Čtvercové Nyquistovy diagramy zřetelně zobrazují podél křivky fázový úhel. POZNÁMKA 3 k heslu Nyquistův diagram je zvláště užitečný při zobrazování přenosových funkcí, jako je přenosová poddajnost.
 Key
Key
3.5.44 Nyquistův diagram
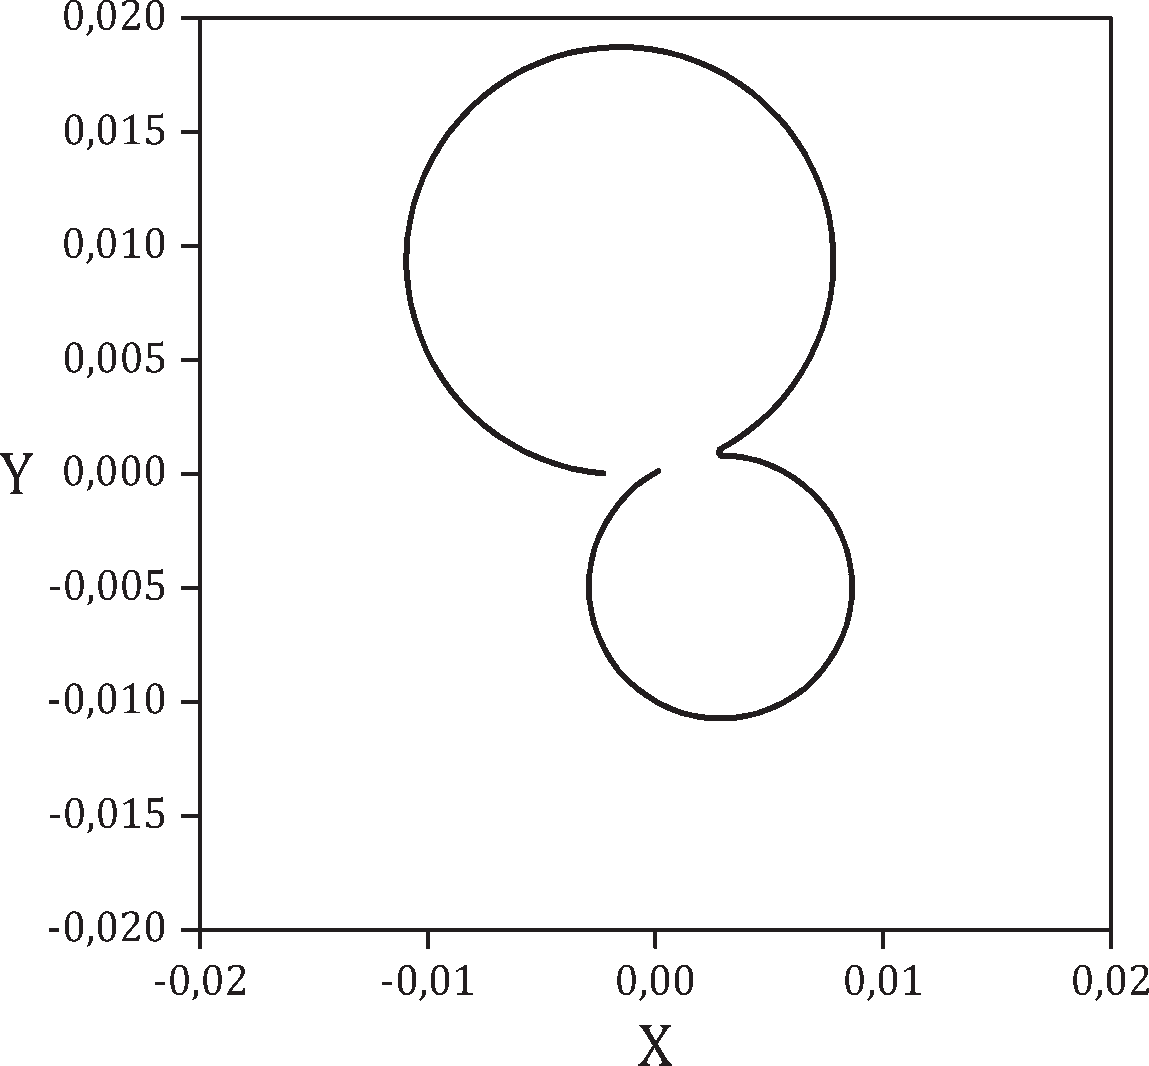
(Nyquist plot) čtvercový diagram, který zobrazuje amplitudu a fázi vibrací v rozsahu frekvencí tak, že na svislé ose jsou vyneseny imaginární složky vibrací a reálné složky vibrací jsou vyneseny na vodorovné ose Legenda Y imaginární část výchylky X reálná část výchylky Obrázek 5 – Nyquistův diagram POZNÁMKA 1 k heslu Frekvence se implicitně vynáší podél výsledné křivky. POZNÁMKA 2 k heslu Čtvercové Nyquistovy diagramy zřetelně zobrazují podél křivky fázový úhel. POZNÁMKA 3 k heslu Nyquistův diagram je zvláště užitečný při zobrazování přenosových funkcí, jako je přenosová poddajnost.
3.5.44 Nyquist plot
square plot that displays the amplitude and phase of a vibration over a range of frequencies with the imaginary components of the vibration are displayed on the vertical axis and the real components on the horizontal axis Key Y
imaginary displacement
X
real displacement
Figure 5 — Nyquist plot Note 1 to entry: Frequency is implicitly displayed along the length of the resulting curve. Note 2 to entry: Square Nyquist plots clearly display the phase angle along the curve. Note 3 to entry: The Nyquist plot is particularly useful for displaying transfer functions, such as transfer compliance.